THIS ARTICLE WILL HELP YOU:
Understand Experience Report
Deriving meaningful insights from your experiences and applying them to improve your website conversion rate is your experiences' ultimate objective. The experience reports help you validate the hypothesis you test and derive a better understanding of your website's visitor behavior.
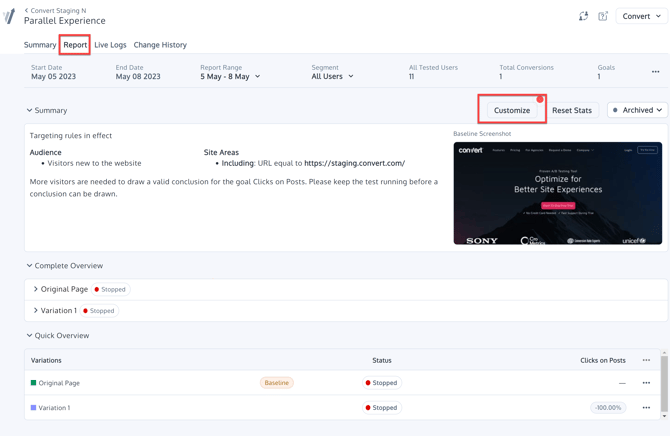
To access your test report, select the experience for which you want to view the report, and go to the REPORT tab.
You will be able to see 5 different sections and customize these per your needs:
- Top Menu
- Summary
- Complete Overview
- Quick Overview
- Goals
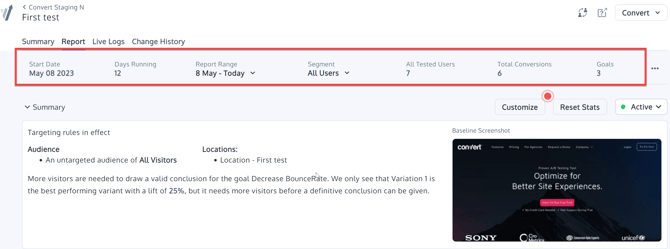
Top Menu
On the top menu you can quickly see this information:
- Start Date: the date when the experience started
- Days Running: how many days the experience is running
- Report Range: date filter enables you to filter data for a specified date range
- Segment: filter the report by visitor segments
- All Tested Users: number of users participating in the test
- Total Conversions: total number of goal conversions
- Goals: number of goals the experience has
You can also use the three-dot menu and apply some further actions:
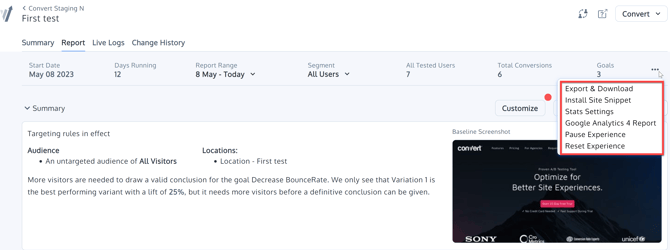
Export & Download
By clicking the first option, Export & Download, a popup appears where you can download the experience data in various formats:
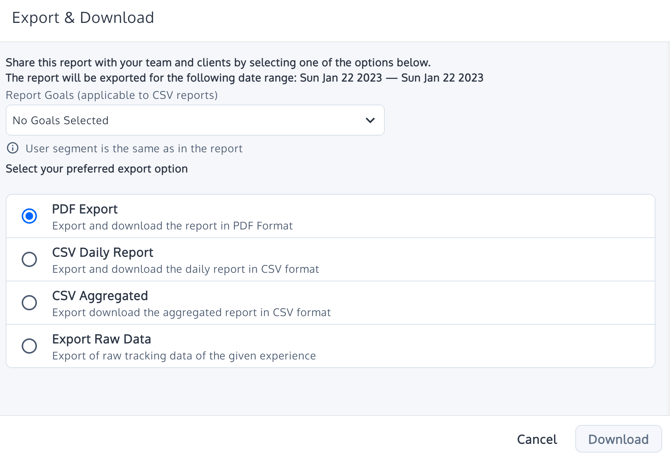
There you can find options for PDF Export, CSV Daily Report, CSV Aggregated. If you select the last option you will be able to download experience raw data (depending on the plan you use).
AOV in Exports: In aggregated reports, AOV is available as the field average_order_value.
API path: reportData.variations.*.metrics.average_order_value (can be null if no revenue metric is present).
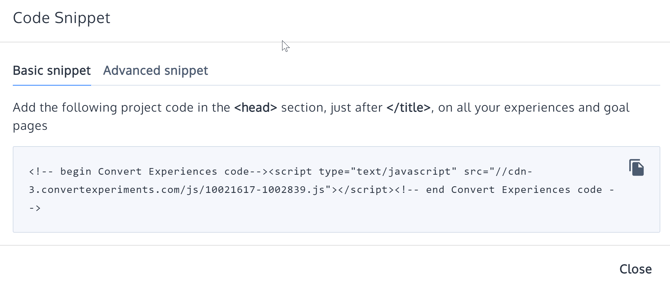
Install site snippet
If you click the second option, Install site snippet, you will be able to access your tracking script:
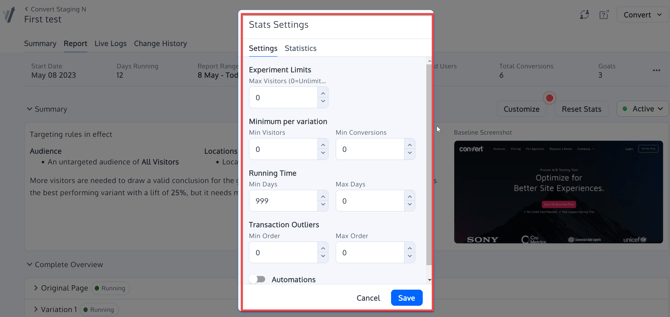
Stats Settings
From the third option, Stats Settings, you can configure these:
- Confidence level (statistical significance) is described here
- Transaction Outliers are described here
- Automations are described here
- Statistical methods are described here
Google Analytics 4 Report
If you have integrated Convert with GA4 you will be able to press on this link and see immediately on another tab the GA4 audiences created for this specific test and the corresponding report.
Start/Pause Experience
This option lets you start/pause your experience.
Reset Experience
The Reset Stats button can reset the experience data.
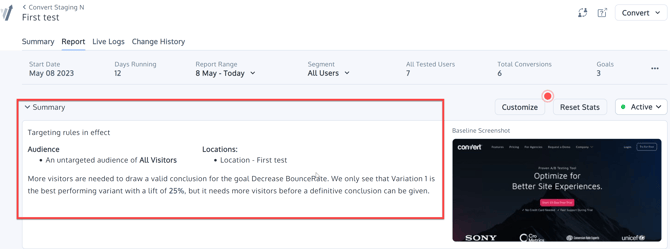
Summary
Summary part of the report summarizes the Locations and Audience conditions that apply to this experience. Additionally, it provides some smart recommendations:
If you hover over the baseline screenshot, you will see some additional options:
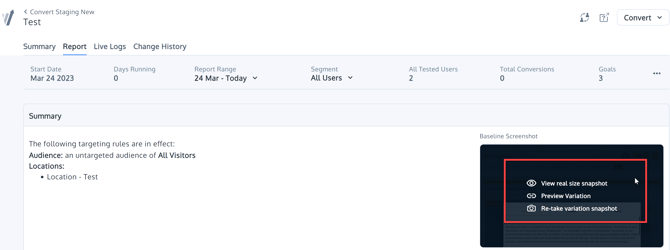
The Preview Variation will open a popup and you will be able to get the Live Preview and Force Variation URLs.
Complete Overview
Complete overview section shows all metrics for all the experience variations:
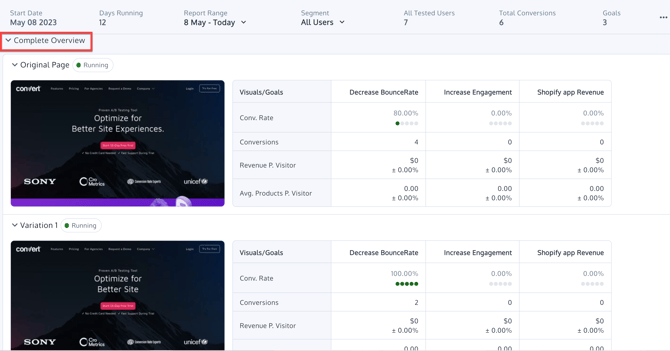
AOV presentation: When you switch to the Revenue / RPV view, the table includes an “AOV” column (Average Order Value) by default.
Placement: AOV appears after RPV and before Confidence Level (see screenshot).
Format: AOV is displayed in the same currency format used for Revenue.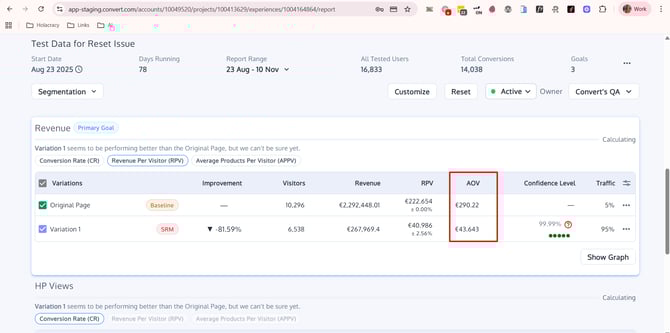
APPO presentation (Average Products Per Order view)
For experiences with revenue + product tracking enabled, the Goals section includes a fourth view toggle for product diagnostics:
- Conversion Rate (CR)
- Revenue Per Visitor (RPV)
- Average Products Per Visitor (APPV)
- Average Products Per Order (APPO)
When you select Average Products Per Order (APPO)
- APPO becomes the primary metric used for Improvement, Confidence Level and Confidence Interval in the table (similar to how CR, RPV or APPV behave in their own views).
- The table shows an “APPO” column directly after “AVG Products”.
- APPO is the average number of products per order for that variation and is calculated as:
APPO = Total products ÷ Total orders
products_cnt data as APPV, but divides by orders instead of visitors.
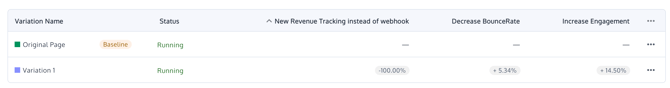
Quick Overview
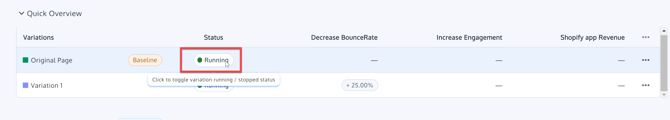
From the Quick Overview section of the report, you can quickly view the variations of your experience and some extra information:
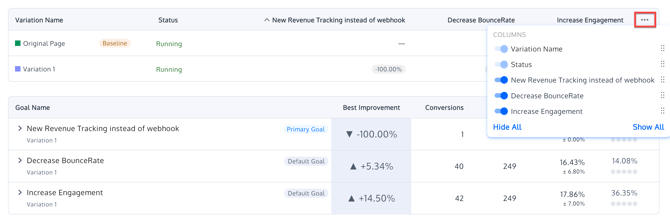
If you click the three-dot menu you can enable/disable columns that you would like to be visible or even re-arrange their order:
If you click on the status you will be able to pause variations.
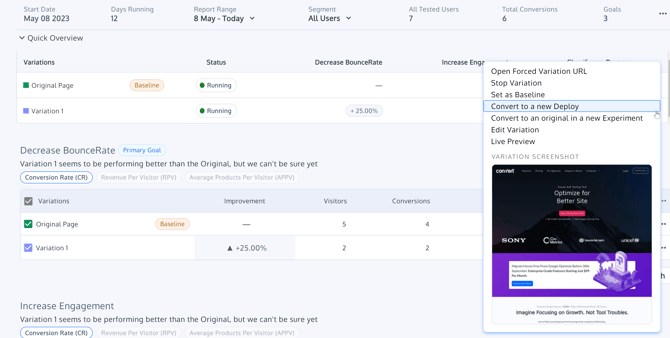
If you click the three-dot menu on one of the variations row you have some extra options:
Column toggles include AOV: You can show/hide the AOV column here; it’s enabled by default.
Graphs: AOV is currently a tabular column only—no dedicated AOV graphs are displayed.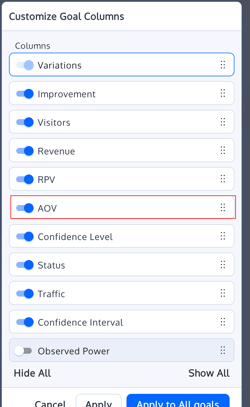
Column toggles for APPO: In APPO view, you can still control APPO’s visibility from the column customization menu:
- The column header in the table is labeled “APPO”.
- In the column picker, the toggle appears as “AVG Products Per Order”.
- Like other columns, you can show/hide it and drag it to change its position.
- If you don’t see APPO in the table, open the column customization menu and enable “AVG Products Per Order” there; your preference is saved in your user display settings.
Goals section
In the goals section, you can see all the goals of the experience and some interesting stats and graphs that we are going to analyze below. Before that, we need to explain a few tags/terms that you might see and not recognize.
- Default Goal: If you see the term Default Goal next to one of your goals that means it is one of the 2 default goals we add to every experience
- Primary Goal: This can only be one and is decided by you. It is the most important goal for your experience. This will be shown first on the goals list and experience status will be changed based on this.
- SRM: Potential Sample Ratio Mismatch detected on your test and you need to contact support@convert.com or check the experience setup.
- Baseline: By default, is your experience baseline.
Columns
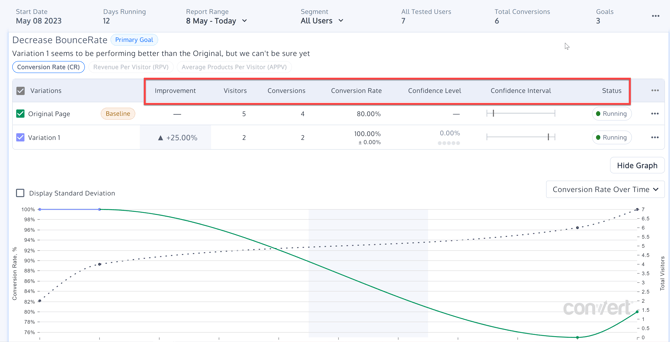
- Variation Name: name of your variation. Next to it, there is a checkbox that you can enable/disable to show or hide the variation stats on the graph
- Improvement: this column reports the percentage change of the variation compared to the Original. When computed confidence is greater than the confidence set in the stats settings the color changes
- Red for -
- Green for +
- Gray for other
- Visitors: the amount of total bucketed visitors in the experience. These are unique visitors.
- Conversions: this represents the total conversions for each goal/variation
- Conversion Rate: this column shows the percentage of visitors that turned into conversions
- AOV (Average Order Value): average revenue per order for each variation, shown as a currency value.
📒 Note:
AOV is displayed in the RPV/Revenue table and is visible by default. Statistical indicators (confidence, intervals) continue to be based on the selected metric (e.g., RPV).
- Confidence Level (statistical significance): this column reports the significance, or how different the confidence interval for the conversion rate for the experiment variation is when compared to the original. If the confidence is not showing any number, this is because (by default) there is a minimum of 5 conversions needed for each variation in order to calculate it. It also must meet the minimum visitors set for each variation. If you have changed the minimum conversions then the minimum you chose would have to be met. The gray/green dots in that column indicate:
- 1 green dot for 75%-85% confidence
- 2 green dots for 85%-95% confidence
- 3 green dots for 95%-96% confidence
- 4 green dots for 96%-97% confidence
- 5 green dots for 97% and above
- Box Plot/Confidence Interval: range of values where the true conversion rate falls.
- Status: status of the variation
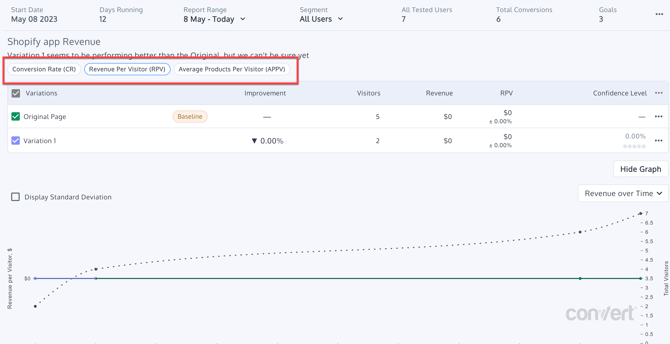
Graphs
There are three available groups of graphs that are explained below:
Conversion Rate (CR)
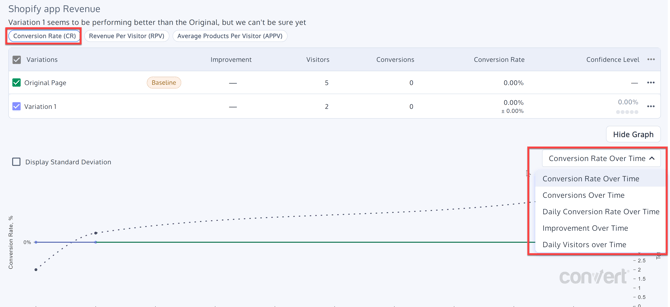
- Conversion Rate Over Time: Y axis shows conversion rate , X axis shows time, the lines are one for each variation (cumulative conversion rate) + one for conversion rate of the whole experiment (average of all variations) + a second axis Y at the right which represent the cumulative number of visitors inside the whole experiment
- Conversions Over Time: Y axis shows conversions, X axis shows time, the lines are one for each variation (conversions) + one for conversions of the whole experiment (average conversions of all variations) + a second axis Y at the right which represent the cumulative number of conversions inside the whole experiment.
- Daily Conversion Rate Over Time: non cumulative conversion rate - same as graph Conversion Rate Over Time, only that we do not show a second Y axis with cumulative visitors and the non cumulative is used for the API
- Improvement Over Time: improvement in conversion rate by day on the X axis and lines each variation (but not original).
- Daily Visitors over Time
Average Products Per Visitor (APPV)
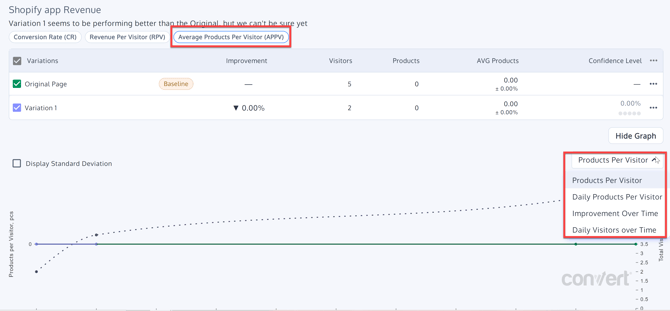
- Products Per Visitor: cumulative average ordered products per visitor - Y axis shows average ordered products per visitor, X axis shows time, the lines are one for each variation (cumulative average ordered products per visitor) + one for average ordered products per visitor of the whole experiment (average of all variations) + a second axis Y at the right which represent the cumulative number of visitors inside the whole experiment
- Daily Products Per Visitor: non cumulative average ordered products per visitor
- Improvement over Time: improvement in products by day on the X axis and lines each variation (but not original)
- Daily Visitors over Time
Revenue Per Visitor (RPV)
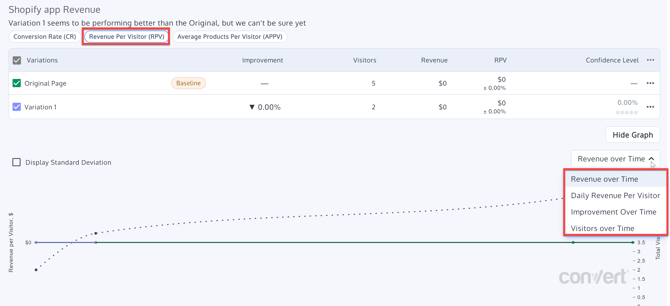
- Revenue over Time: cumulative average revenue per visitor - Y axis shows average revenue per visitor, X axis shows time, the lines are one for each variation (average revenue per visitor) + one for average revenue per visitor of the whole experiment (average of all variations) + a second axis Y at the right which represent the cumulative number of visitors inside the whole experiment
- Daily Revenue Per Visitor: non cumulative average revenue per visitor
- Improvement over Time: improvement in revenue by day on the X axis and lines each variation (but not original)
- Visitors over Time