
| Author: | Ahmed Abbas |
THIS ARTICLE WILL HELP YOU:
- Get an Overview of Looker Studio Connector
- Know the Pre-requisites
- Know the Steps
- Step 1: Open the Convert Experiences Connector
- Step 2: Authenticate With Your Convert API Credentials
- Step 3: Enter the Experience Details
- Step 4: Choose a Report Type
- Step 5: Apply Optional Segmentation Filters
- Step 6: Connect the Data Source
- Step 7: Create an Aggregated Performance Report
- Step 8: Create a Daily Trend Report
- Understand some Additional Report Ideas
- Learn Changing an Existing Connection
- Troubleshoot
- Know some Best Practices
Overview
The Convert Experiences Looker Studio Connector brings Convert experiment-reporting data directly into Looker Studio. You can use it to create dashboards that show visitors, conversions, conversion rates, revenue, confidence, statistical significance, variation performance, and daily trends.
This direct connector is different from the existing GA4 and BigQuery reporting methods. Those methods analyze Convert impression events alongside GA4 conversion data, while this connector retrieves experiment-reporting data using your Convert API credentials.
What You’ll Need
Before you begin, make sure you have:
- A Convert Experiences account
- A Google account with access to Looker Studio
- Your Convert API Key
- Your Convert API Secret
- Your Convert Account ID
- Your Convert Project ID
- The Experience ID you want to report on
You can find your API credentials under:
Account Settings > Integrations > API Keys
Your Account ID, Project ID, and Experience ID are also visible in your Convert dashboard URL.
Step 1: Open the Convert Experiences Connector
Open the Convert Experiences community connector in Looker Studio:
📒 Note:
Replace INSERT_PRODUCTION_CONNECTOR_URL with the connector’s production URL before publishing this article.
Looker Studio displays information about the connector and may warn that it is a community connector that has not been verified or reviewed by Google. Only authorize community connectors from sources you trust.
Select Authorize, review the requested permissions, and then select Allow.
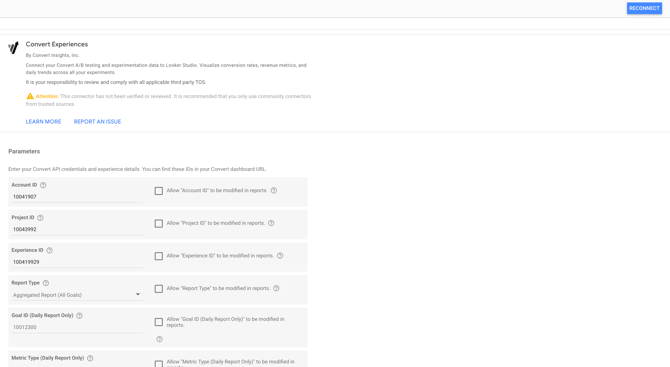
Convert Experiences community connector in Looker Studio.
Step 2: Authenticate With Your Convert API Credentials
When Looker Studio requests authentication, enter the following:
| Looker Studio field | Convert value |
| Username | Your Convert API Key, also called the Application ID |
| Password | Your Convert API Secret |
⚠️ Important:
Do not enter the email address and password you normally use to sign in to Convert. The connector’s Username and Password fields refer to your API Key and API Secret.
Select Authenticate to verify the credentials.
Step 3: Enter the Experience Details
After authentication, configure the experience you want to report on.
| Field | What to enter |
|---|---|
| Account ID | The Convert account containing the project |
| Project ID | The project containing the experience |
| Experience ID | The experiment or personalization you want to analyze |
A Convert dashboard URL may look like this:
https://app.convert.com/accounts/123456/projects/10100123/experiences/10012345
In this example:
- Account ID:
123456 - Project ID:
10100123 - Experience ID:
10012345
Step 4: Choose a Report Type
The connector supports two report types.
Option A: Aggregated Report — All Goals
Select:
Report Type: Aggregated Report (All Goals)
Use this report type when you want to:
- Compare overall performance across variations
- Analyze all goals attached to the experience
- Display conversion and revenue metrics
- Review statistical confidence and significance
- Build executive summaries or experiment-overview dashboards
The Goal ID and daily metric settings are not used for aggregated reports.
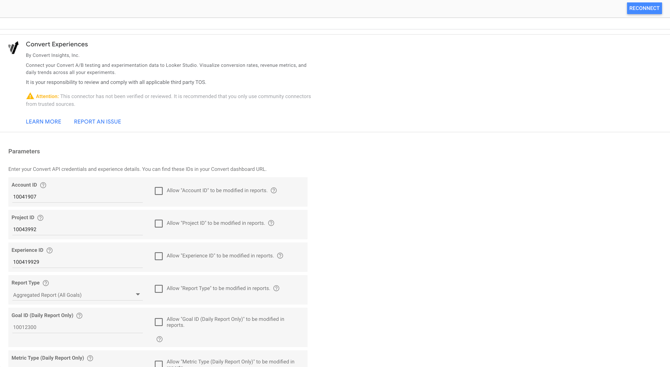
Configuring an aggregated Convert Experiences report.
Option B: Daily Report — Single Goal
Select:
Report Type: Daily Report (Single Goal)
Then configure:
| Field | Description |
|---|---|
| Goal ID | The Convert goal you want to analyze |
| Metric Type | The metric returned for each date |
| Report Aggregation | Whether values are daily or cumulative |
Available metric types may include:
- Conversion Rate
- Average Revenue per Visitor
- Average Products Ordered per Visitor
Available aggregation options include:
- Non-Cumulative: Shows values for each individual day.
- Cumulative: Shows running results over the selected period.
Daily reports are best suited to trend analysis and monitoring how a particular goal changes over time.
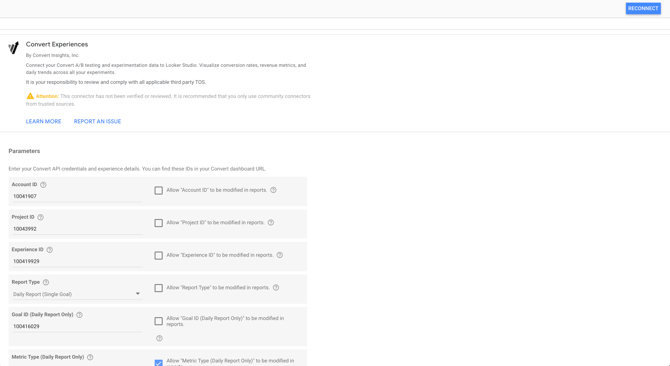
Configuring a daily report for a single Convert goal.
Step 5: Apply Optional Segmentation Filters
The connector can filter the returned results using several optional parameters.
Available filters include:
| Filter | Example |
|---|---|
| Device Filter | Desktop, iPhone, iPad, All Phones |
| Browser Filter | Chrome, Firefox, Safari, Edge |
| Country Filter | US,GB,CA |
| Visitor Type Filter | New visitors or returning visitors |
| Campaign Filter | summer-sale,black-friday |
| Source Filter | google,facebook |
| Custom Segment IDs | 12345,67890 |
Leave a filter empty to include all available visitor data for that dimension.
💬 Tip:
When troubleshooting an empty report, remove optional filters temporarily. Combining several restrictive filters can exclude all available data.
Step 6: Connect the Data Source
After completing the configuration, select Connect.
Looker Studio displays the fields returned by the connector. Review their data types and default aggregation settings before creating a report.
Aggregated and daily reports return different field schemas. If you later switch report types, use Refresh Fields so Looker Studio can load the correct schema.
Aggregated Report Fields
An aggregated report can include the following fields.
Identification and status fields
- Variation ID
- Variation Name
- Goal ID
- Is Baseline
- Statistically Significant
- Test Complete
- SRM Detected
Conversion metrics
- Visitors
- Conversions
- Conversion Rate
- CR Change %
- CR Confidence Interval
- Confidence / Chance to Win
Revenue and product metrics
- Total Revenue
- Revenue per Visitor
- Revenue Change %
- Average Order Value
- Total Products Ordered
- Products per Visitor
Statistical diagnostics
- SRM P-Value
These fields can be used as dimensions, metrics, filters, or report controls depending on their data type.
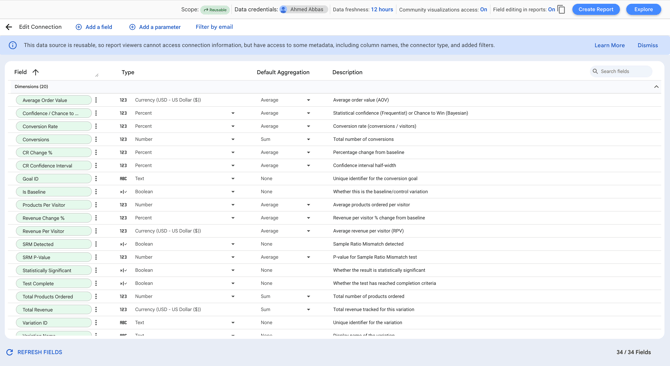
Fields available in an aggregated Convert Experiences data source.
Daily Report Fields
A daily report contains a smaller schema designed for time-series analysis.
| Field | Description |
|---|---|
| Date | Date of the data point |
| Variation ID | Unique identifier for the variation |
| Variation Name | Display name of the variation |
| Daily Visitors | Visitors recorded for the date |
| Metric Value | The selected rate or average metric |
| Totals | Conversions, revenue, or product totals, depending on the metric |
The meaning of Metric Value and Totals depends on the Metric Type selected in the connector configuration.
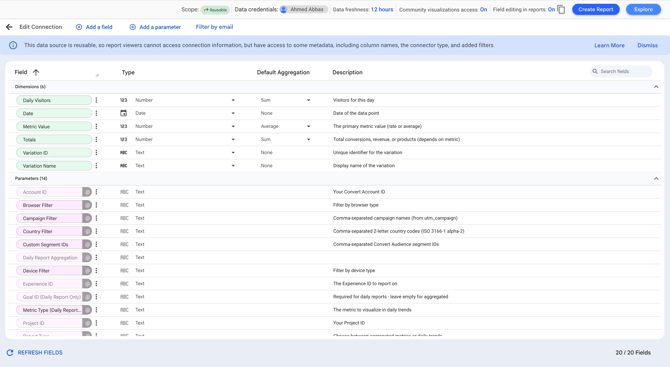
Fields available in a daily Convert Experiences data source.
Step 7: Create an Aggregated Performance Report
After connecting an aggregated data source, select Create Report.
A useful starter dashboard can include the following components.
Visitor scorecard
- Metric: Visitors
Conversion scorecard
- Metric: Conversions
Variation-performance table
- Dimension: Variation Name or Variation ID
- Metrics: Visitors, Conversions, Conversion Rate, CR Change %, and Confidence / Chance to Win
Conversion-rate chart
- Chart type: Bar chart
- Dimension: Variation Name
- Metric: Conversion Rate
Goal-performance table
- Dimensions: Goal ID and Variation Name
- Metrics: Conversions, Conversion Rate, and Statistically Significant
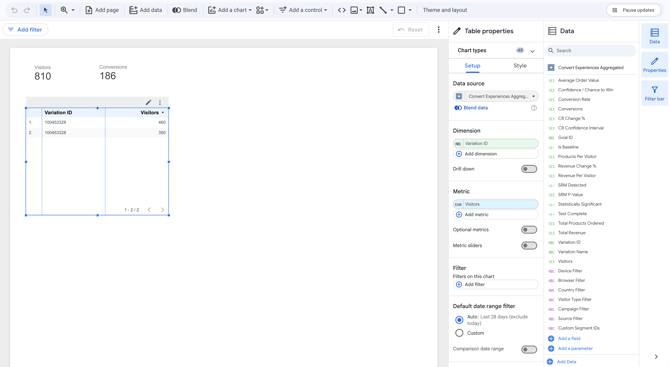
Example aggregated report showing visitors by variation.
Step 8: Create a Daily Trend Report
For a daily data source, add a time-series chart.
Recommended configuration:
- Chart type: Time series
- Dimension: Date
- Metric: Metric Value or Daily Visitors
- Breakdown dimension: Variation Name
Use Metric Value when analyzing the selected conversion-rate, revenue, or product average.
Use Daily Visitors when monitoring traffic over time.
Use Totals when you need daily or cumulative conversions, revenue, or product totals, depending on the connector configuration.
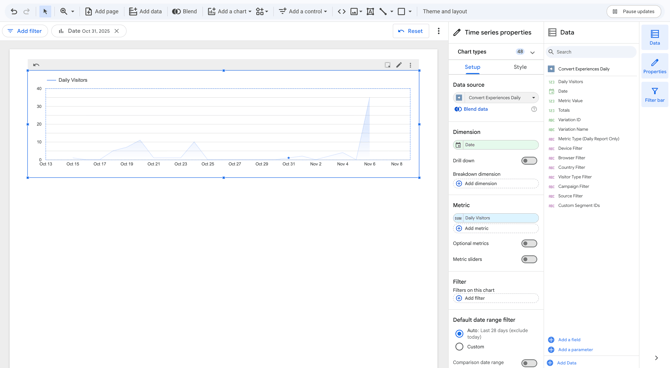
Example daily visitor trend report
Additional Report Ideas
Experiment overview
Create:
- Visitors scorecard
- Conversions scorecard
- Conversion Rate by Variation chart
- Variation comparison table
- Statistically Significant filter
Multi-goal comparison
Use an aggregated report and create a pivot table:
- Rows: Goal ID
- Columns: Variation Name
- Values: Conversions and Conversion Rate
Revenue dashboard
Add:
- Total Revenue scorecard
- Revenue per Visitor by Variation
- Average Order Value by Variation
- Revenue Change % table
Segment comparison
Create separate data sources for the same experience using different connector filters.
For example:
- Data source 1: Device Filter = Desktop
- Data source 2: Device Filter = All Phones
You can then place both data sources in the same report for side-by-side comparison.
Change an Existing Connection
To update the experience, report type, goal, metric, or segmentation settings:
- Open the Looker Studio report.
- Go to Resource > Manage added data sources.
- Find the Convert data source.
- Select Edit.
- Select Edit connection.
- Modify the connector parameters.
- Reconnect the data source.
- Select Refresh Fields if the schema changed.
Changes to a reusable data source can affect every report that uses it.
Data Freshness
Looker Studio displays the configured freshness interval at the top of the data-source editor.
The supplied screenshots show a 12-hour data-freshness setting. Confirm the production connector’s intended refresh and caching behavior before publishing a more specific refresh guarantee.
📒 Note:
The original draft states that Looker Studio caches data for ten minutes and returns near-real-time data, while the supplied screenshots show a 12-hour freshness interval. This wording should be confirmed with the connector owner before publication.
Troubleshooting
Invalid credentials or Unauthorized
Check that:
- The API Key is active.
- The API Secret is correct.
- The API Key was entered in the Username field.
- The API Secret was entered in the Password field.
- You did not enter your normal Convert login details.
To authenticate again:
- Edit the data source.
- Select Edit connection.
- Re-enter the API Key and API Secret.
- Select Reconnect.
No data returned
Confirm that:
- The Account ID is correct.
- The Project ID is correct.
- The Experience ID is correct.
- The selected date range overlaps the period in which the experience collected data.
- The experience has received visitors.
- The Goal ID belongs to the selected experience.
- Optional filters are not too restrictive.
For daily reports, also confirm that the selected metric is applicable to the selected goal.
A 403 response is returned
A 403 response generally indicates that the supplied credentials do not have access to the requested account, project, or experience.
Confirm that the API Key has permission to access all IDs entered in the connector.
A 404 response is returned
A 404 response generally indicates that one of the requested resources could not be found.
Verify:
- Account ID
- Project ID
- Experience ID
- Goal ID, for daily reports
Fields are missing after changing the report type
Aggregated and daily reports return different schemas.
After changing the Report Type:
- Reconnect the data source.
- Select Refresh Fields.
- Update charts that relied on fields from the previous schema.
Best Practices
- Create one data source per experience.
- Include the experience and report type in the data-source name.
- Use aggregated reports for summaries and variation comparisons.
- Use daily reports for time-series analysis.
- Start with a simple table before building additional visualizations.
- Add explanatory text describing the experiment hypothesis, primary goal, variations, and reporting period.
- Review SRM Detected before interpreting results.
- Review Statistically Significant and confidence metrics before presenting a winner.
- Make a copy of an important report before changing its data-source configuration.
For more advanced report-layout and dashboard-design guidance, see the existing Looker Studio dashboard template article.
Advanced Alternative: Use GA4 and BigQuery
The direct connector is recommended for most Convert experiment dashboards. It provides aggregated and daily Convert reporting without requiring a Google Cloud project or custom SQL.
Consider the GA4 and BigQuery approach when you need to:
- Combine Convert variation assignments with GA4 events
- Analyze custom conversion or micro-conversion events
- Build funnels across several user actions
- Query event-level data
- Join experimentation data with other warehouse data
- Create custom metrics not available through the direct connector
For this approach, see Advanced: Build Convert Experiment Reports in Looker Studio Using GA4 and BigQuery.