🚀 THIS ARTICLE WILL HELP YOU:
- What is a Hypothesis
- How to Create a Hypothesis
- How to Prioritize a Hypothesis
- How to Use the Hypotheses screen
- How to sort, search and filter hypotheses
- How to Edit or Delete a Hypothesis
- How to Turn a Hypothesis to an Experience
- Share with Collaborators
This article gives information on what is a hypothesis, how to create it, and how to use it in Convert.
🔹 What is a Hypothesis
Instead of randomly testing ideas that you ‘feel’ are good, the focus should be on building a solid hypothesis that maximizes chances for winning.
A hypothesis is an assumption that a proposed change in your website would lead to visitors taking the action that you want them to.
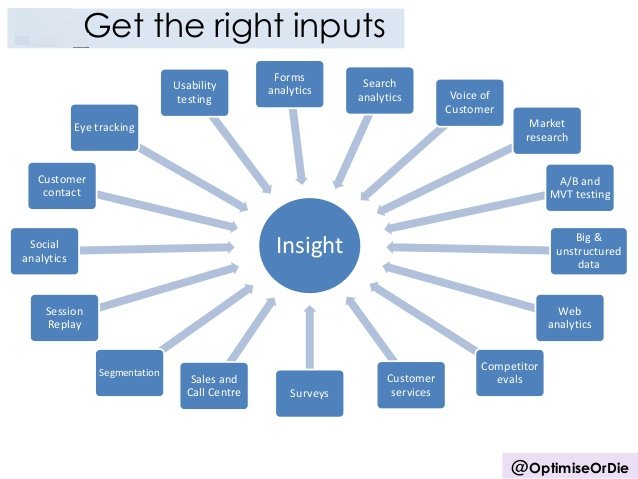
Many avenues can be explored to find good hypotheses. The image below by the popular Conversion Expert, Craig Sullivan, shows several ways in which you can collect meaningful insights.
In Convert, you build hypotheses manually, through the Compass left menu, based on your internal insights you have collected. As a part of your internal research, you identify the problem areas in your website; the factors that are contributing to your visitors not converting into customers, thus leading to conversion leaks. Hypothesizing follows next.
A Hypothesis is created to plug those leaks and fix the conversion issues. For example, if you notice that the sign-up button—visible only when a user scrolls down the page—is not fetching enough clicks, you can build a hypothesis that moving the sign-up button above the fold should attract more clicks. For validating the hypothesis, you can run an experience.
🔹 How to Create a Hypothesis
You typically create a hypothesis to depict a projected change and it's potential impact on your website conversions.
In Convert, you can create a Hypothesis from the top tab that is called Compass:

Once you are there, click on the New Hypothesis blue button on the right top corner:

A new window will appear where you need to start filling in details for your new hypothesis:

- Hypothesis Name: Enter a brief informative name of the Hypothesis.
- Objective: Enter the problem that you are addressing and also enter a solution that you expect will solve the Hypothesis problem. For example, changing the color of Sign-up button from orange to green may attract more clicks.
- Prioritization Score: Prioritization will help you organize the multiple hypotheses in a logical order. Enter a score for each prioritizing parameter based on the prioritization model you have selected. Compass will calculate the priority score for the hypothesis based on the score you provide to each parameter. To know more about prioritizing Hypothesis, click here.
- Status of Hypothesis: Select a status of the hypothesis based on these values:
- Draft: means that anyone can continue working on the hypothesis
- Completed: hypothesis has been finalized and can be turned into an experiment
- Applied: hypothesis is now applied to an experiment (A/B or Split URL)
- Archived: hypothesis has been applied, experiment has run and hypothesis is no longer needed
- Tags: Enter tags to make the Hypothesis easily searchable.
- Start and End dates: enter dates for your hypothesis. Start date could be a past date when you or your colleagues actually came up to this hypothesis. End date can be the date when you expect that the hypothesis is turned into an experience.
- Summary: Give a summary of your hypothesis.
🔹 How to Prioritize a Hypothesis
While you create hypotheses, one of the details that you need to enter is the prioritization score.
Prioritizing will help you sort the multiple hypotheses in a scientific manner. The closer a hypothesis is to the top of the list, the higher is its priority. There is a rating system in the dashboard to help you choose a hypothesis you feel has the maximum probability of accomplishing the change in conversion towards the desired direction.
Every time you create a new hypothesis, you are presented with the option to rate the hypothesis by giving it the Prioritization Score.

There are two prioritization models you can use: PIE or ICE.
1️⃣ PIE prioritization model
This model of hypothesis prioritization ranks hypotheses according to their Potential for improvement, Importance and Ease. In the PIE model, hypotheses are ranked from highest to lowest priority, using a scale of 1 to 5.
There are three parameters you must rate on a scale of 1 to 5:
- Potential: On a scale of 1 to 5 (1 being the lowest, and 5 being the highest), select how likely it is that the hypothesis will result in an overall improvement?
- Importance: On a scale of 1 to 5 (1 being the lowest, and 5 being the highest), select how crucial the visitor landing on the test pages (for which the hypothesis is created) is.
- Ease: On a scale of 1 to 5 (1 being the most difficult, and 5 being the easiest), select the complexity of the hypothesis. Rate how difficult it’ll be to implement the changes identified for the hypothesis.
2️⃣ ICE prioritization model
The Impact, Confidence, and Ease model is very similar to PIE, except it uses a confidence factor in place of “potential”.
There are three parameters you must rate on a scale of 1 to 5:
- Impact: On a scale of 1 to 5 (1 being the lowest, and 5 being the highest), impact demonstrates how much your hypothesis will positively affect the key metric you are trying to improve.
- Confidence: On a scale of 1 to 5 (1 being the lowest, and 5 being the highest), confidence shows how sure you are about Impact. It is also about ease of implementation in some way.
- Ease: On a scale of 1 to 5 (1 being the most difficult, and 5 being the easiest), ease is about the easiness of implementation. It is an estimation of how much effort and resources are required to implement this hypothesis.
✨ Considerations before you rate your hypothesis
-
How confident are you of achieving the uplift?: Prototyping the user persona you are targeting can help you in determining the potential of a hypothesis. With a sound understanding of your audience, you can make an educated assumption on whether the hypothesis will address the users’ apprehensions and doubts and nudge them to convert.
-
How valuable is the traffic you are running this test for?: Your website may be attracting visitors in large numbers, but not all visitors become buyers. Not all convert. For example, a hypothesis built around the checkout page holds higher importance than the one built around the product features page.
-
How easy is it to implement this test?: Next comes determining the ease of implementing your test. Try to answer some questions: Would it require a lot of strategizing on your part to implement the hypothesis? What is the effort needed in designing and developing the solution proposed by the hypothesis? Can the changes suggested in the hypothesis be implemented using just the Visual Editor, or does it warrant adding custom code?
🔹 How to Use the Hypotheses screen
To access the Hypotheses screen, on the top tab, click Compass.

On this screen, you can perform the following actions:
-
Manage and track hypotheses based on various statuses as mentioned above.
-
Create a hypothesis as described above
-
Sort, search and filter hypotheses
-
Edit or delete a hypothesis
- Turn a Hypothesis into an Experience
🔹 How to sort, search and filter hypotheses
You can sort the various columns by using this arrow:

You can also filter or unfilter the hypotheses that you view in the Hypotheses screen:

This dropdown has different options of which you can select what you would like to see which are:
- Filter by Status
- Filter by Score

You can select them alternatively, to provide you with the best view that fits your work at any moment.
Finally, you can search your Hypotheses based on names or tags:

🔹 How to Edit or Delete a Hypothesis
Use the 3 dot icon on the right side to edit or delete an existing hypothesis:

🔹 How to Turn a Hypothesis to an Experience
When a hypothesis has the status of Completed, which means all editing on the hypothesis has been done, there is a way to turn that hypothesis into an experience (A/B or Split URL at the moment). Simply use these icons from the 3 dot icon:

🔹 Share with Collaborators
We do not have additional access levels for Compass, rather we use the existing hierarchy structure that is described here.