THIS ARTICLE WILL HELP YOU:
Experience Overview Screen
You can get to the Experiences Overview by following the steps that are presented below:
- Click on the Project Name on the Project Overview.
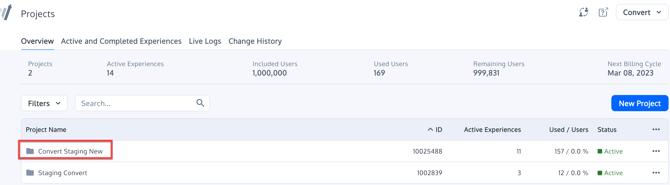
- Click on the "Experiences" menu item on the top:
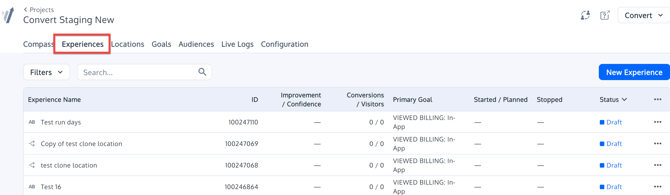
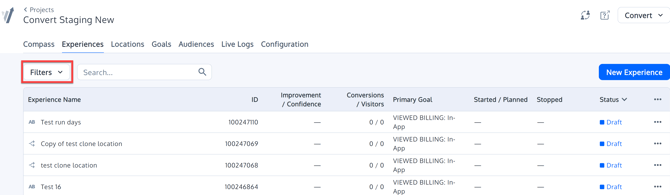
Experience Overview Columns
The Experiences Overview screen provides a list of the experiences created in your Project. It provides several columns with detailed information about them (click on the 3 dot menu to show/hide any of these columns):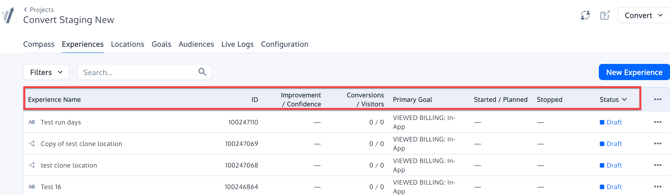
- Name.
- The experience name and icon representing the type of experience (A/A test, A/B test, Split URL, MVT, Multipage or Deploy).
- ID of the experiment
- Improvement / Confidence (only on experiments):
- Improvement: this column reports the percentage change of the variation compared to the Control;
- Confidence: this column reports the significance, or how different the confidence interval for the conversion rate for the experiment variation is when compared to the control/original variation (this must be at least 97% confident before being marked as a winner). The gray/green dots in that column indicate:
- 1 green dot for 75%-85% confidence
- 2 green dots for 85%-95% confidence
- 3 green dots for 95%-96% confidence
- 4 green dots for 96%-97% confidence
- 5 green dots for 97% and above
- Conversion / Visitors (only on experiments):
- Conversions: This represents the total conversions for the primary goal, since the experience was started. The primary goal can be assigned on the goal selection tool.
- Visitors: The amount of total bucketed visitors in the experience. These are unique visitors.
- Primary Goal (only on experiments): The primary goal included in the experience.
- Started/Planned. Time when the experience was activated.
- Stopped. Time when the experiment was stopped
- Status. This can vary between, Draft, Active, Completed, Archived.
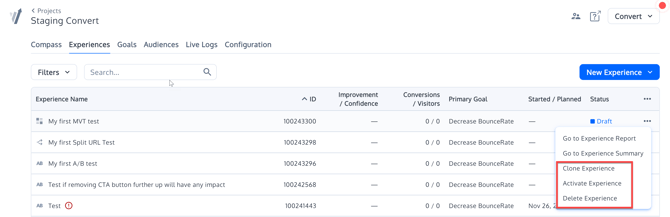
- Actions. If you click on the 3 dot menu on an experience row you will get access to some actions
- Clone. Make an identical copy of the experience without its data.
- Edit. Edit the experience settings.
- Archive. This archives the experience. This action cannot be undone, and after this the data of the experiment is lost.
*Deployments do not provide data on the Improvement / Confidence, Conversions, Goals columns.
Filters
To help you find your experiences on the "Experiences Overview" screen, you are able to filter them by different criteria.
To reach the filtering configuration, just click on the Filters button on the upper right side.
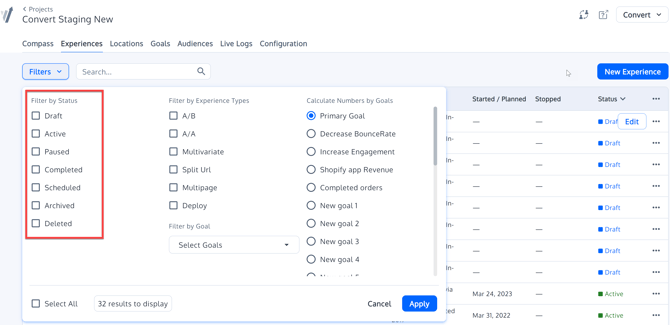
Filter by Status
Experiences on the Experiences Overview can be filtered by Status. A common practice here is to deselect the Archived experiments, so they are hidden while working.
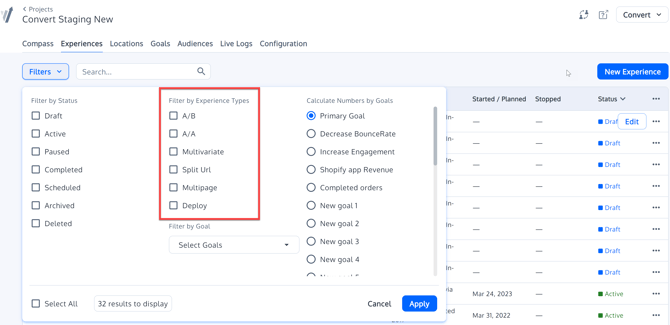
Show Hide Experience Types
You can filter your experiments based on the Experience Type.
- A/B Experiment
- A/A Experiment
- Deploy
- Split Url Experiment
- Multivariate Experience
- Multi-page Funnel Experiment
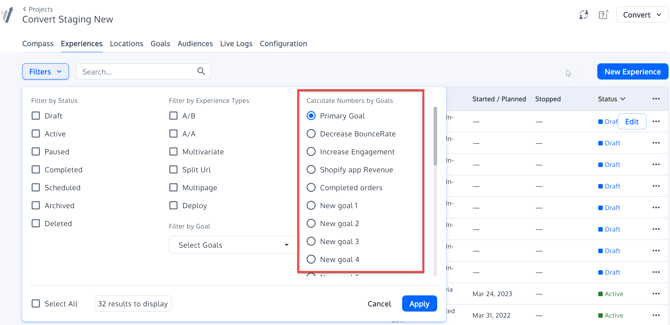
Calculate Number by Goal
This allows you to select the goal for which Conversions, Confidence, Improvement will be shown in the Experiences Overview columns. All your project goals will be listed. The default setting is to calculate them based on the primary goal of the experiment.
Filtering Enabled
When having the filtering enabled, the Filters button becomes grey and is renamed to Filtered.